Local delivery has moved from a pandemic-era scramble to a permanent fixture of how people shop. Customers now expect their orders quickly, cheaply, and with full visibility from checkout to doorstep — and the businesses that win are the ones reading the numbers and adapting to them. The global market for last-mile delivery was estimated at roughly $167.36 billion in 2025 and is projected to reach about $348.85 billion by 2033, a compound annual growth rate near 9.8%.
That growth doesn’t guarantee anyone a profit, though. The same forces driving expansion — rising volumes, faster delivery promises, and the expectation of free shipping — are squeezing margins for businesses that haven’t modernized their operations. Here are the local delivery statistics worth keeping in front of you as you run your delivery business in 2026.
The local delivery market in 2026
The market for getting goods from a local hub to a customer’s door is enormous and still expanding. Analysts segment it by service type, vehicle, delivery speed, and location, but the headline is simple: demand keeps rising. Grand View Research pegs the global last-mile market at about $167 billion in 2025, growing toward $349 billion by 2033.
A few structural facts shape that market today:
- North America is the single largest region, accounting for roughly 31% of the global last-mile market in 2025, thanks to a mature e-commerce ecosystem and dense delivery networks.
- Business-to-consumer delivery dominates, making up close to 70% of the market — a direct reflection of online shopping habits.
- Human-driven, non-autonomous delivery is still the backbone, even as drones and sidewalk robots grab headlines. Vans, cars, and two-wheelers remain how the overwhelming majority of local orders actually move.
The takeaway for an owner-operator isn’t the size of the number — it’s the direction. Local delivery is no longer a nice-to-have add-on; it’s a core channel, and the operational bar keeps rising. Understanding on-demand and crowdsourced delivery trends is increasingly part of staying competitive.
E-commerce and parcel volume keep climbing
Local delivery growth tracks e-commerce growth, and the e-commerce numbers are still moving up and to the right. In the first quarter of 2026, U.S. retail e-commerce sales reached $326.7 billion, about 16.9% of all retail sales and up 9.8% year over year, according to the U.S. Census Bureau. Online sales have been growing meaningfully faster than total retail — meaning a bigger share of every dollar now ends in a delivery.
All those orders translate into parcels. The Pitney Bowes Parcel Shipping Index reports that U.S. parcel volume reached 23.1 billion shipments in 2025, up 3.3% year over year, with volumes projected to climb toward 31 billion by 2031. The competitive landscape underneath that number is shifting too: regional and alternative carriers more than doubled their revenue share in a single year, and Amazon Logistics has grown into one of the largest parcel handlers in the country.
For a local delivery business, the signal is twofold. The pie is growing, but so is the field of players fighting for each delivery — including agile regional carriers and merchants who have decided to run their own routes rather than hand every order to a national carrier.
What customers expect from local delivery now
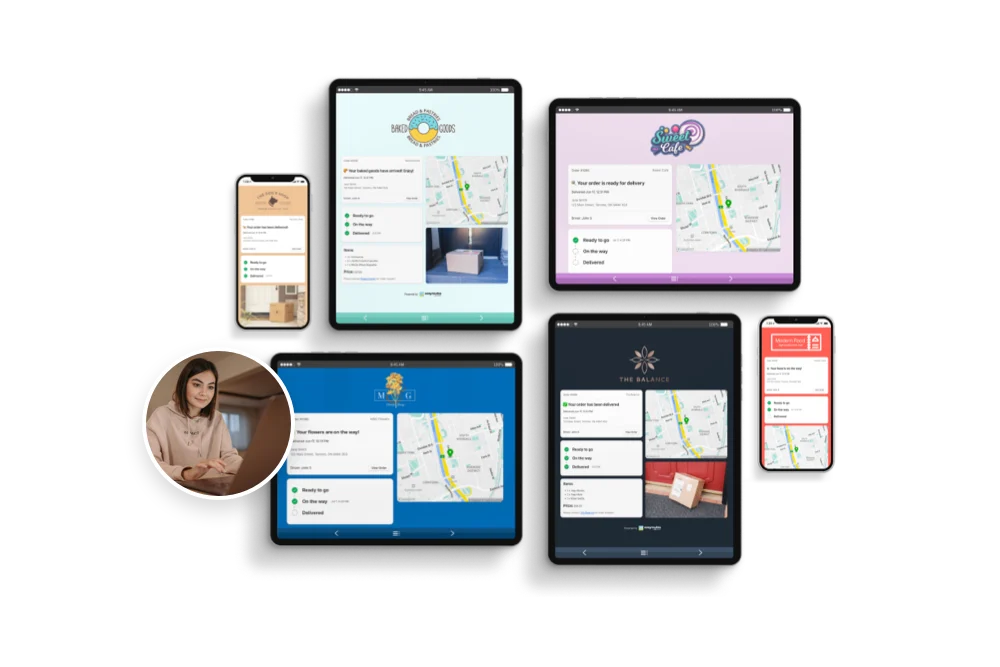
Consumer expectations have hardened, and they pull in two directions at once: people want delivery to be cheap (ideally free) and reliable. A McKinsey survey of more than 1,000 U.S. shoppers found that about 90% of consumers are likely to abandon a cart that carries high shipping costs, and that buyers now rank on-time reliability as more important to their satisfaction than raw speed.
That reframes the whole game. The race isn’t only about being fastest — it’s about keeping the promise you made at checkout. The same research found that roughly half of shoppers actively track their orders to confirm they’re on time, and a majority value the ability to schedule or redirect deliveries. In other words, visibility and flexibility have become part of the product, not a bonus. We dig into this further in our guide to what makes a great delivery experience.
A few patterns every local operator should internalize:
- Free shipping is the default expectation. Unexpected delivery fees are a leading reason shoppers bail at checkout, which is why so many merchants now build delivery cost into product pricing or set free-shipping thresholds. Our breakdown of free delivery strategy covers how to do this without torching your margins.
- Reliability beats speed. A delivery that lands inside the promised window earns more loyalty than one that’s merely fast but unpredictable.
- Tracking is table stakes. Customers expect to know where their order is, and proactive updates reduce anxious “where is my order” inquiries. Real-time tracking and notifications have shifted from differentiator to baseline.
- Same-day and local options are growing. Demand for same-day delivery continues to rise, especially for groceries, food, and urgent items.
The cost of last-mile delivery
The reason local delivery is hard isn’t mystery — it’s math. The final leg is the most expensive part of the journey. According to the Capgemini Research Institute, last-mile delivery accounts for roughly 41% of total supply-chain costs, and by other measures more than half of total shipping cost lands in that final stretch. Capgemini also warns that businesses running suboptimal delivery models can see profits erode by as much as 26%.
Those costs come from labor, fuel, vehicle wear, and the stubborn economics of dropping single packages at scattered addresses. They climb further every time a delivery fails on the first attempt and has to be re-run. The squeeze is sharpest because the customer increasingly refuses to pay: Capgemini’s figures show the cost to the business of a delivery often exceeds what the customer is willing to pay for it.
Several trends keep upward pressure on last-mile costs:
- A continued shift from in-store shopping to online ordering, raising delivery volumes.
- Customer demand for free or heavily subsidized shipping, which transfers cost to the merchant.
- Tight labor markets and fuel-price volatility.
- Urban congestion, scarce curbside space, and failed first-attempt deliveries.
- Faster delivery promises — including same-day — that reduce the room to batch and consolidate stops.
This is exactly where smart operations pay for themselves. Cutting miles driven, raising first-attempt success, and squeezing more stops into each route attack the biggest cost line directly. Our deep dive on last-mile delivery costs walks through the full breakdown and the levers that move it.
Why these local delivery statistics matter
Knowing the numbers is useful; acting on them is what separates a growing delivery business from a struggling one. Statistics let you benchmark your own performance against the market, spot which trends have staying power, and decide where to invest.
A few principles for putting these figures to work:
- Don’t chase hype — chase margins. Some market trends exist to give customers savings at the retailer’s expense. Test what actually works for your operation before committing.
- Measure what the market measures. Track your own on-time rate, cost per delivery, first-attempt success, and route efficiency so you can compare apples to apples. Our guide to delivery metrics every business should track lays out the KPIs that matter.
- Reinvest the savings. Efficiency gains from better routing free up budget for the customer-facing improvements — tracking, flexibility, reliability — that the statistics say drive loyalty.
Upgrade your local delivery software to stay ahead
The data points in one direction: the local delivery market will keep growing, and so will the operational pressure. The fastest way to absorb that pressure is to replace manual planning with modern delivery management software. Done well, the right platform:
- Plans and re-optimizes routes in seconds instead of hours, attacking the largest cost line in last-mile delivery.
- Keeps customers informed automatically with tracking links and proactive notifications.
- Improves first-attempt delivery success and captures proof of delivery.
- Scales across multiple drivers, vehicles, and even multi-day delivery plans.
- Surfaces the analytics you need to benchmark against the market.
At the heart of all of this is route optimization — the difference between a driver crisscrossing a city and a tight, efficient run that fits more stops into the same shift.
Frequently Asked Questions (FAQs)

What is local (last-mile) delivery?
Local or last-mile delivery is the final step of the fulfillment journey — moving an order from a local hub, store, or distribution center to the customer’s door. It’s the only physical touchpoint between a brand and its customer, which is why it carries so much weight for both cost and customer experience.
Why is last-mile delivery so expensive?
Because it involves dropping individual packages at scattered addresses, with costs from labor, fuel, vehicle wear, and failed deliveries. Capgemini estimates the last mile makes up around 41% of total supply-chain costs, and the customer is usually unwilling to pay the full amount — so the business absorbs the gap.
Is local delivery a profitable business in 2026?
It can be. Rising e-commerce and parcel volumes mean strong demand, but profitability depends on tight operations. Reducing miles, improving first-attempt success, and automating routing and notifications are what turn growing volume into actual margin.
What do customers expect from delivery now?
Low or free shipping, on-time reliability, and full visibility. Survey data shows shoppers will abandon carts over high shipping costs and value an on-time delivery within the promised window more than raw speed.
How can I improve my local delivery operation?
Start with your routes and your communication. Optimizing routes cuts cost and improves reliability, while automated tracking and notifications meet customer expectations. Good delivery management software like EasyRoutes brings both together in one workflow.
EasyRoutes gives you local delivery superpowers for Shopify
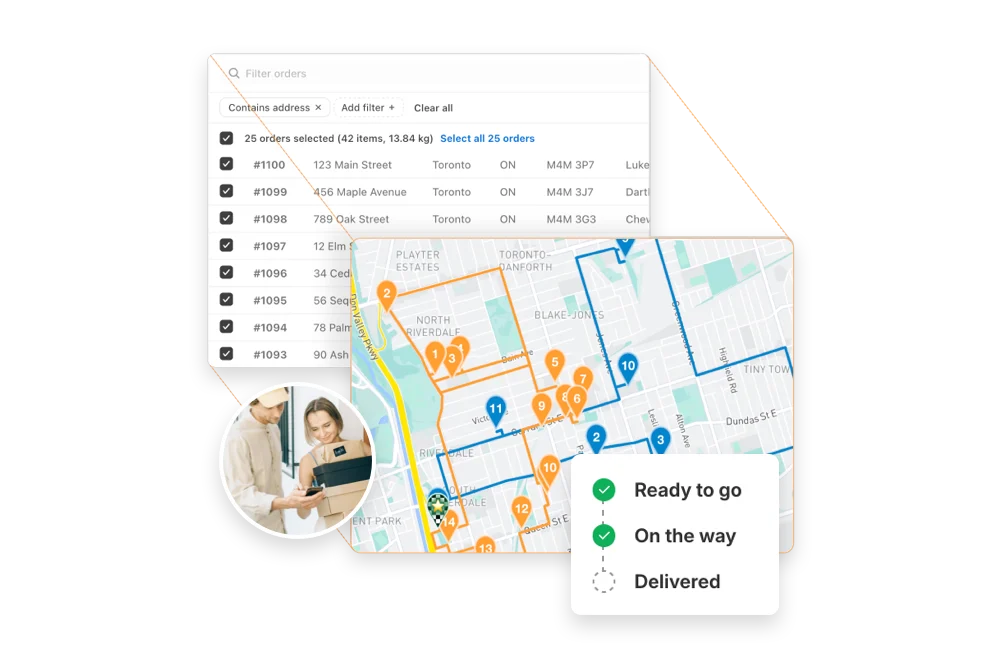
EasyRoutes is a powerful route planning and delivery management app built for delivery businesses on Shopify that want to plan and optimize their routes efficiently.
EasyRoutes can optimize your routes automatically — factoring in service time, delivery time windows, vehicle capacity, and preferences like avoiding ferries, tolls, and highways — then keep your customers informed with tracking links and notifications, and capture proof of delivery at the door.
Companies can focus on their core business and cut hours of manual planning and scheduling, while EasyRoutes takes care of the rest.
You can use EasyRoutes for free, or try any of the paid plans free for 14 days!