















Monitor delivery performance, track key KPIs, and surface operational insights, driving continuous improvement across delivery teams.

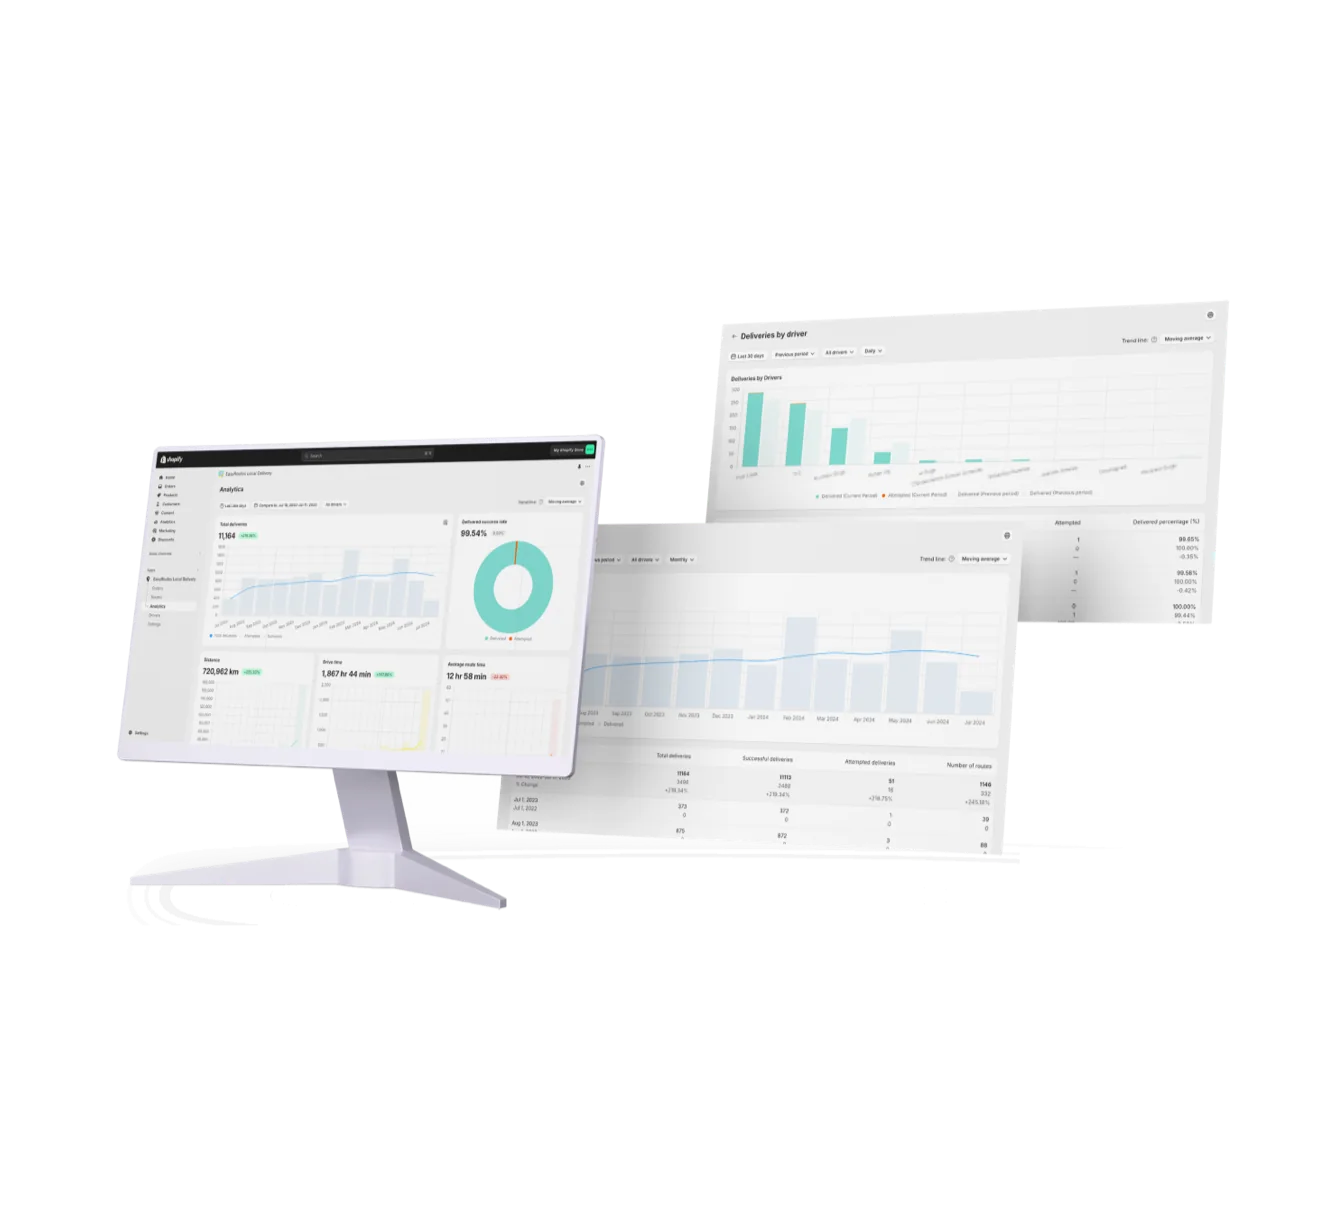
Without proper insights, it’s difficult for businesses to identify inefficiencies or optimize their delivery operations. EasyRoutes’ delivery analytics provides real-time data and post-delivery performance reports, helping businesses monitor key metrics such as delivery times, driver productivity, and on-time rates.
With this data at your fingertips, you can pinpoint bottlenecks, adjust routes, and improve fleet performance over time. EasyRoutes doesn't just show you what happened — it tells you what to do next.


Delivery Analytics shows totals and trends for stops and routes, including completed vs. missed deliveries, average delivery time, per‑driver performance, and route metrics over a chosen period.
See: Delivery Analytics
Yes. Delivery Analytics reports completion rates, average delivery times, and success rates; filter by driver or date and export to CSV.
See: Analytics
Yes. Analytics includes a delivered vs. missed/attempted view over your selected period and or driver. Use it to track delivery success rates.
See: Analytics Reports
Yes. Analytics shows counts of missed deliveries; individual stop pages display the reason provided by the driver (e.g., no answer, inaccessible).
Yes. Use the date picker to select common presets (7/30 days) or a custom start and end date; Analytics refreshes to that range.
See: Filtering by Date
Analytics updates as delivery events are recorded. Refresh the Analytics page to see the latest numbers; event details also appear in each route’s Activity Feed.
See: Delivery Analytics · Activity Feed
Yes. Export Analytics as CSV for reporting or reconciliation. Choose your date range/driver filter, then select Export or Print from the Analytics page.
Your on-time rate is the share of deliveries completed within their scheduled window, based on stop completion timestamps; view it by period and driver in Analytics. See: Analytics
Yes. Pick a time period and an optional comparison period, break data down by driver, and use linear or logarithmic trend lines; export any breakdown to CSV. See: Analytics
EasyRoutes tracks route distance and time in Analytics; pair Vehicle Profiles (which store fuel economy) and break data down by vehicle to gauge fuel and cost, and compare periods for savings. See: Analytics
Not automatically — analytics are viewed in the dashboard and exported on demand (copy or CSV). For recurring reporting, export on a cadence yourself or pull data via the API/webhooks. See: Analytics