The Delivery Metrics & KPIs Every SMB Should Track
By Joe SnyderTrack the delivery metrics and KPIs that cut costs and lift satisfaction—from on-time rate and cost per delivery to driver performance and safety.

Track the delivery metrics and KPIs that cut costs and lift satisfaction—from on-time rate and cost per delivery to driver performance and safety.
Delivering on time isn’t just good customer service—it’s a performance metric. For small and mid-sized businesses managing local delivery, keeping things running smoothly often comes down to tracking the right numbers. Whether you’re dropping off meal kits, managing floral delivery, or offering same-day laundry delivery, the ability to measure and act on your delivery metrics is what separates consistent growth from constant chaos.
It matters more than ever because the last mile has become the most expensive part of the journey. According to a widely cited industry study, last-mile delivery now accounts for 53% of total shipping costs, up from 41% in 2018. When the shortest leg of the trip eats the biggest share of the budget, knowing exactly what to track—and why—is the difference between a delivery operation that scales and one that quietly bleeds margin. This guide cuts through the noise and zeroes in on the delivery KPIs that keep your team accountable, your customers satisfied, and your operations lean—including the driver-performance and safety metrics that protect your bottom line.
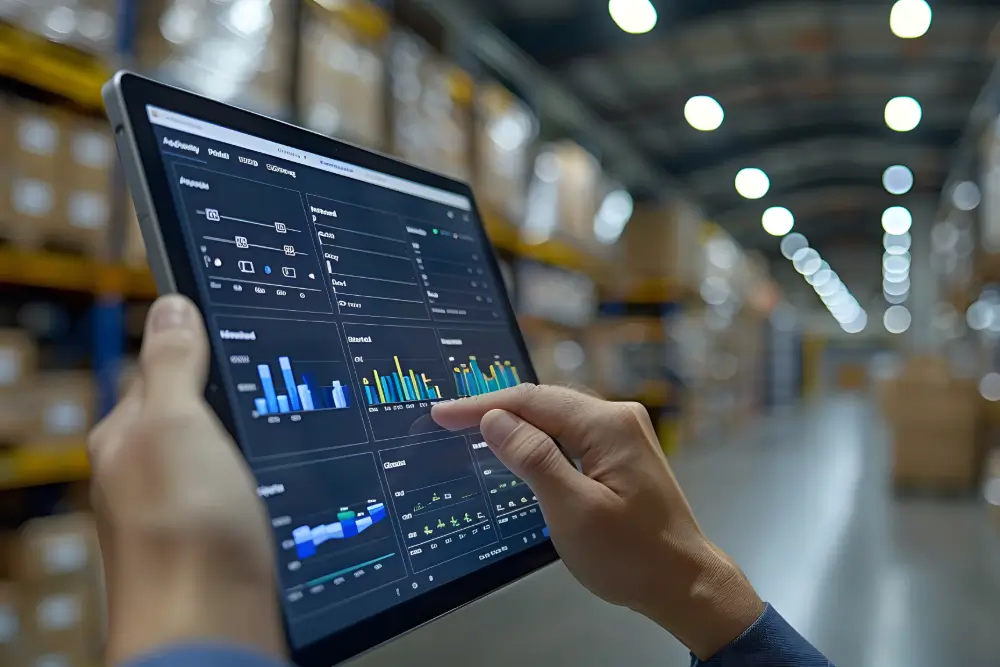
If you can’t measure it, you can’t manage it. Metrics give your business clarity. They show where you’re excelling, where you’re bleeding time or money, and where a small tweak can make a big difference. For grocery delivery teams, metrics reduce spoilage and delays; for furniture delivery businesses, time-on-site data minimizes loading issues. Across industries, the value of delivery data lies in making better decisions faster—and preventing small issues from becoming big ones.
The metrics that follow fall into three buckets: customer-facing outcomes (did the delivery arrive on time and intact?), operational efficiency (what did it cost and how far did the truck travel?), and driver performance and safety (who’s delivering well, and who’s a risk?). The strongest operations watch all three, because they compound each other—a speeding, unsafe driver isn’t just a liability, they’re also burning fuel and missing time windows.
Your on-time delivery rate is the clearest measure of how well your operation meets customer expectations. It tracks the percentage of deliveries completed within the promised time window. For pizza, coffee, or bookstore deliveries, OTD is a make-or-break metric.
Even one late delivery can erode trust, while consistently hitting your windows builds loyalty and recurring business. If your OTD slips below 95%, it’s time to examine your routing, staffing, and communication workflows. Because late deliveries quietly cost you reviews, repeat customers, and partnerships, OTD deserves a permanent spot on your dashboard—our guide to why on-time delivery matters breaks down exactly what reliability is worth. With a tool like EasyRoutes, delivery windows and ETAs are built into every route, helping your team stay on track from the moment orders hit the schedule.
This metric tracks how long it takes, on average, to complete a delivery from dispatch to drop-off. It’s essential for teams doing butcher delivery, medical supply delivery, or garden center delivery, where time sensitivity is critical.
Monitoring this number helps you understand how traffic, route planning, or driver behavior is affecting efficiency. High variability may signal an issue with route sequencing or peak-time planning. Improving it doesn’t just speed things up—it increases capacity. Faster deliveries mean you can handle more stops without adding hours or drivers.
Closely related to OTD, your delivery success rate measures the percentage of orders delivered on the first attempt without issues or delays. A high first-attempt rate is a sign of efficient routing, accurate address data, and clear customer communication. It’s one of the most underrated KPIs because it sits upstream of so many costs: every order that lands on the first try is one you don’t pay to attempt twice. Accurate addresses, realistic time windows, and proactive notifications are the levers that move it most.

You can’t optimize what you don’t understand. Cost per delivery rolls up fuel, labor, vehicle wear, and overhead for each order fulfilled. It’s crucial for every business, but especially lower-margin categories like produce delivery or clothing delivery. Labor is typically the single largest line item, with fuel a volatile second—which is why a detailed breakdown of last-mile delivery costs is worth keeping close as you calculate yours.
Knowing this number lets you price your service intelligently, evaluate promotions, and decide whether to adjust delivery zones or windows. If your cost is creeping up, automation and batching are usually the low-hanging fruit to bring it back in check.
A failed delivery is more than a missed stop—it’s wasted fuel, time, and customer trust. In fact, every failed attempt effectively re-runs the full cost of a delivery, often two or three times for a single shipment. This metric tracks how often drivers are forced to reschedule or reattempt drop-offs, and why.
It’s especially relevant for teams offering catering, firewood delivery, or subscription box delivery, where coordinating with the customer can be tricky. High redelivery rates usually point to gaps in notifications or unclear drop-off instructions. Solutions like EasyRoutes cut failed deliveries by sending real-time ETAs and delivery status updates—so customers know when to expect you and how to prepare.
Sometimes the most important numbers are the ones your customers give you. A Customer Satisfaction Score (CSAT)—gathered through post-delivery ratings, survey responses, and comments—surfaces service gaps that operational data alone can miss. It’s telling that across last-mile complaints, delayed deliveries, missing items, and damaged goods together account for roughly two-thirds of all customer grievances, per CDS Logistics analysis. A timely delivery that arrived soggy, broken, or at the wrong door is still a failure in the customer’s eyes.
For businesses like cleaners, bakery delivery, or plant store delivery, sentiment often hinges on presentation and handling—not just punctuality. Monitor satisfaction trends, share feedback with drivers, and make feedback loops part of your improvement process.

Tracking mileage per route and per delivery gives you visibility into fuel costs, driver productivity, and environmental impact. The opportunity here is bigger than most teams realize: studies show that out-of-route miles typically account for around 10% of total mileage—miles you pay for that move no orders. Shaving them off lowers fuel spend, reduces wear, and shortens delivery times all at once.
If you’re managing hardware delivery, seafood delivery, or laundry delivery, pay close attention to how routes are constructed. Are you doubling back? Are zones too wide? Smart route optimization tightens sequencing automatically, and pairing it with disciplined fuel habits is one of the most reliable ways to cut gas costs across your delivery business.
Drivers are your frontline, and their performance shapes every other metric on this list. Productivity signals—deliveries per shift, time between stops, and proof-of-delivery accuracy—tell you where coaching or support is needed. Set a clear definition of what “good” looks like, then use the data to celebrate wins and address issues constructively. Continuous visibility helps here; learn how to implement driver tracking effectively so insights come from real activity rather than guesswork.
Safety belongs on the same scorecard, because unsafe driving is expensive in ways that don’t show up until a claim lands. National data attributes roughly $9.8 billion in annual employer costs to speeding-related crashes, plus another $7.4 billion when seat belts go unused. The average on-the-job traffic crash runs about $25,000, and roughly 20% of a fleet is involved in some kind of crash each year. A handful of metrics make driver safety measurable rather than anecdotal:
Pairing these metrics with a simple incentive scheme—a gift card, an Employee-of-the-Month nod, or a year-end safe-driving bonus—turns measurement into motivation. Just make sure every driver knows the objective criteria you use, so rewards build morale instead of resentment. For a fuller playbook, see our guide to driver safety best practices for delivery teams.
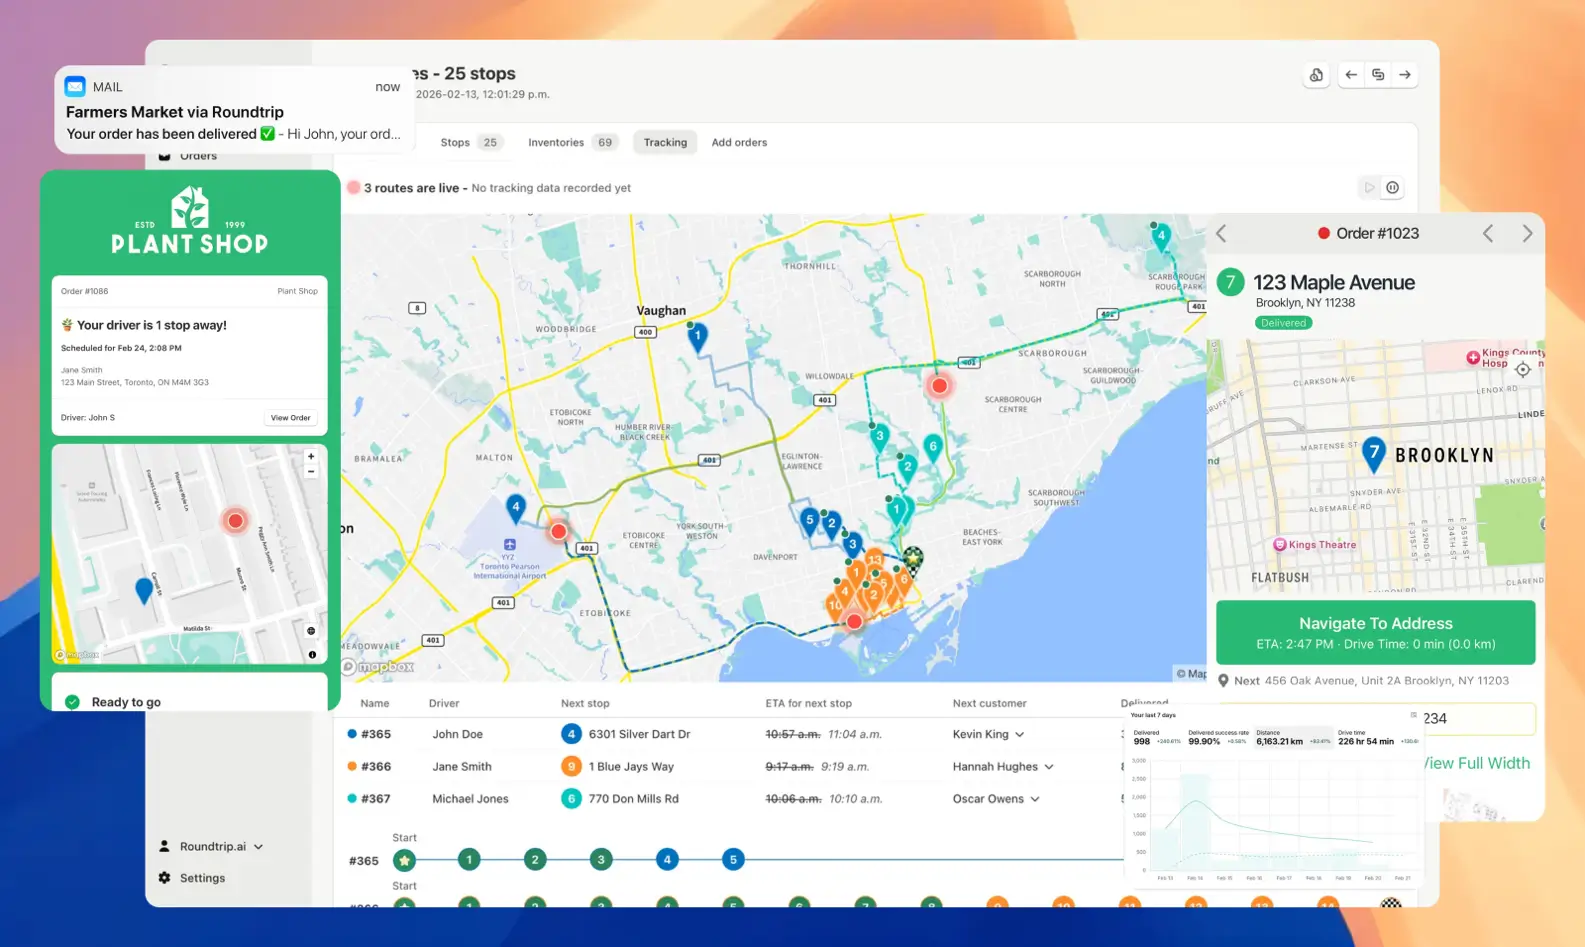
When you use EasyRoutes, delivery metrics aren’t an afterthought—they’re built in. From route planning to real-time tracking and notifications, EasyRoutes collects the data you need to manage performance and spot inefficiencies early.
Whether you’re handling deliveries for meal kits, flowers, or a bookstore, EasyRoutes helps you reduce planning time, improve accuracy, and keep customers informed. You can view route performance at a glance, track driver activity, capture proof of delivery, and export analytics to a spreadsheet—refining your workflow without guesswork.
Illuminate Food, a local grocery delivery business, realized their growing order volume was also growing their delivery times. Without a clear sense of their performance, they couldn’t identify what needed to change.
After implementing EasyRoutes, they gained real-time visibility into delivery windows, mileage, and stop times. With accurate metrics in hand, they optimized their batching strategy, reduced delays, and improved on-time performance—earning better reviews and fewer support calls. With EasyRoutes, every delivery became a learning opportunity.
For growing delivery businesses, tracking the right metrics isn’t about bureaucracy—it’s about clarity. When you measure outcomes that matter, you make better decisions, grow more sustainably, and give customers a consistently great experience. The smartest operations watch the full picture: customer outcomes, operational cost, and the drivers who make every delivery happen.
From pizza delivery to butcher delivery, medical supplies to plants, the best delivery operations never stop improving. If you’re ready to transform your delivery data into actionable insights, EasyRoutes gives you the tools to deliver with confidence, measure success, and keep moving forward.
Yes. Export Analytics as CSV for reporting or reconciliation. Choose your date range/driver filter, then select Export or Print from the Analytics page.
Analytics updates as delivery events are recorded. Refresh the Analytics page to see the latest numbers; event details also appear in each route’s Activity Feed.
See: Delivery Analytics · Activity Feed
Yes. Enable Delivery Ratings so customers can leave star ratings and optional comments on the tracking page after delivery. Export results or review per driver from their profile pages.
See: Delivery Ratings
Absolutely. Drivers can add photos, collect an e‑signature, and record notes at each stop; these appear in the route and customer tracking (if enabled).
See: Proof of Delivery
Yes. Drivers can mark stops as Out for Delivery, Delivered, or Attempted and attach proof of delivery from the mobile app.
Yes. Use the customizable Rescheduled notification (email/SMS) to explain delays, provide a new ETA/date, and include the tracking link.
EasyRoutes optimizes deliveries using your selected orders, start & end locations, stop time intervals, time windows, and route limits. You can balance routes, respect capacities, and re‑optimize as plans change.
See: Route Options · EasyRoutes 101
EasyRoutes is the AI-native delivery operations platform trusted by 5,000+ businesses across 75+ countries. Plan routes in seconds, dispatch drivers automatically, and delight your customers — from Shopify or any order source. Experience delivery operations that run themselves. Rated 4.9 stars and certified Built for Shopify.
⭐⭐⭐⭐⭐ 4.9 stars • Trusted by 5,000+ Businesses